How Can We Help?
Genrating KPI Reports
KPI #1 (Key Performance Indicators)
This report displays the # of Units, Severity, Cycle Time, Units per Day, Sales, OEM, A/M, LKQ, and OEM parts % for each sort option.
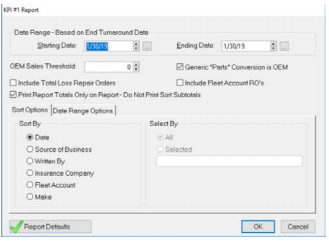
OEM Threshold Box
RO’s with OEM parts percentages equal to or higher than the selected threshold will show the parts % highlighted in yellow. (All RO’s will still be shown, but those with threshold’s lower than the selected % will not be highlighted).
Generic Parts Conversion Box
If this box is checked, any part that does not have a specific account code (OEM, AM, LKQ) will be counted as an OEM.
Sort Options
Date – Shows the totals for each RO within the date range selected. Source of Business – Shows the numbers for each Source of Business. This is taken from the Source Field in Customer Info Screen.
Written by – Lists the RO totals for each writer. This is based on who is listed in the Writer field on the customer info screen.
Insurance Company – Lists the RO totals for each insurance company. This is based on what insurance company is listed in the customer info screen.
Fleet Account and Make – Lists the RO totals for each Fleet Account or Make. This is based on the Fleet Account or Make fields on the customer info screen.
Date Range
Use the Date Range options tab to specify what designations are used to compile the report information.
Examples:
Date In to Date in Shop will calculate staging cycle times.
Date in Shop to Date Completed will calculate body cycle times.
Date completed to Date Delivered calculates delivery cycle time.
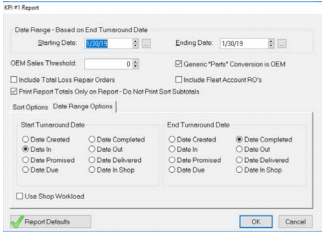
Use Shop Workload Box
Check this box to use actual shop work days (will not count weekends and holidays) to calculate cycle times.
Review KPI
This report is broken down by insurance company. It shows the average severity of repairs, average cycle time (keys to keys), average touch time and percentage of OEM parts used. For a $2500 the average cycle time should be 5 days. The average touch time should be 5.